
From NASA
by Natasha Vizcarra
Adelie penguins scan the ice sheet in search of food. They peck for silverfish and hunt for polynyas, gaping holes in the sea ice where schools of krill and beetle-like copepods graze on clouds of algae. When spring arrives, the giant sea ice sheets begin to melt and then all but disappear in the short Antarctic summer. Then algal blooms unfold: a Bacchanalian festival for krill and creatures along the Antarctic food chain. Sea ice, sunlight and food – they all come and go with the seasons in the Southern Ocean.
Paul Holland, climate modeler for the British Antarctic Survey, has studied the sea ice in Antarctica and the Southern Ocean for the past decade. Lately he’s been researching the seasons in Antarctica and how fast the ice comes and goes. Holland believes these seasons of the year could be a key to a mystery: if temperatures on Earth are getting warmer and sea ice in the Arctic is shrinking rapidly, then why is sea ice in Antarctica slowly rising?
A Weddell seal hunts for food under the sea ice near McMurdo Sound in Antarctica. (S. Rupp / National Science Foundation)
Opposite poles
Sea ice is simply frozen sea water. Although only found in the Arctic and Antarctic, it affects the Earth’s climate to a large extent. Its bright surface reflects sunlight back into space. Icy areas absorb less solar energy and stay relatively cool. As temperatures warm over time and more sea ice melts, fewer bright surfaces reflect sunlight back into space. The ice and exposed sea water absorb more solar energy and this leads to more melting and more warming.
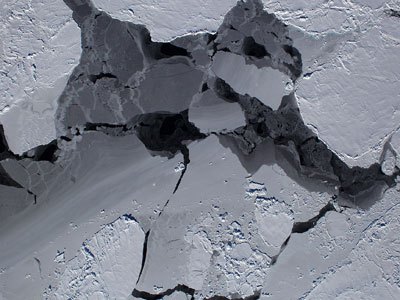
This scene shows a mix of sea ice types that are common in the Southern Ocean. The various thicknesses of the sea ice form a spectrum of colors and shapes, ranging from dark black open water to a thin, greasy shell called fat ice to thicker gray ice. Older sea ice has a bright white blanket of snow and many chaotic deformation features that are visible as ridges and debris fields caused by the continuous movement of the ice pack. (Courtesy of M. Studinger / NASA)
Scientists have observed this feedback loop of warming and melting in the Arctic. For them, the Arctic sea ice is a reliable indicator of a changing global climate. They pay the most attention in September, when the Arctic sea ice is the least shrinking each year. Measured by satellites since 1979, this minimum has decreased by up to 13.7 percent per decade. The Antarctic sea ice, on the other hand, was not viewed as an indicator of climate change. While the Arctic sea ice is mostly located in the middle of the inland sea, which is more sensitive to sunlight and warming air, the Antarctic sea ice surrounds the land and is constantly exposed to strong winds and waves.
According to climate models, rising global temperatures should cause the sea ice to shrink in both regions. However, observations show that the ice extent in the Arctic has shrunk faster than predicted and has increased slightly in the Antarctic. Researchers take a much closer look at Antarctica and say, “Wait, what’s going on down there?” Holland is one of those who are fascinated.
“The Antarctic case is as interesting as the Arctic case,” said Holland. “You can’t understand one thing without understanding the other.”
Maintain the models
For Holland, the discrepancy calls parts of the climate models into question. Modeling groups from around the world are collaborating on the Coupled Model Intercomparison Project Phase 5 (CMIP5), which simulates the Earth’s climate and predicts how it will change in the near future. World leaders and policymakers rely on it to decide how much to limit carbon emissions from countries that are known to cause some aspects of climate change.
“Almost all CMIP5 models result in a decrease in Antarctic sea ice,” said Holland. “There’s a problem in the bit that reproduces the variability of sea ice over the past 30 years.” Holland was looking for data to improve and verify his own modeling of trends in the Antarctic ice when he noticed that other researchers were finding that the trends varied in magnitude over the different seasons.
Most studies of Antarctic sea ice trends focus on changes in ice extent. It was more important for Holland to see how quickly the ice was growing or shrinking from season to season. “Changes in climate forcing have a direct effect on the rate of ice growth,” he said, “not the amount of ice.” For example, a year-to-year cooling in autumn can lead to faster ice growth in autumn, but not necessarily to an increase in the amount of autumn ice.
A pressure ridge forms on the sea ice near Scott Base in Antarctica. These form when separate ice floes collide and stack on top of each other. Lens clouds can be seen above. (Courtesy of M. Studinger / NASA)
Spring surprise
Holland used data from NASA’s National Snow and Ice Data Center’s Distributed Active Archive Center (NSIDC DAAC) to calculate the rate of growth in ice concentration for each individual day, which he called intensification. and the total rate of growth of the ice sheet, which he called expansion. “I’ve been doing this data and recording the trends for every thirty years,” he said. The Dutch plots showed that different regions in the Southern Ocean contributed to the overall increase, but they showed very different trends in sea ice growth. This suggested that geography and different wind patterns played a role. To get more insight, Holland examined the seasonal wind trends for the different regions.
Holland found that winds spread sea ice in some regions and compressed or kept it intact in others, and that these effects started in the spring. It contradicted an earlier study in which Holland and Ron Kwok of NASA’s Jet Propulsion Laboratory (JPL) used ice drift data to find that increasing north winds in the fall caused the fluctuations.
“I’ve always thought, and as far as I can tell everyone else, that the biggest changes have to be in autumn,” said Holland. “But the big result for me now is that we have to see spring. The trend is bigger in the fall, but seems to arise in the spring. “
“Paul has created two more sea ice metrics that we can use to assess how the Antarctic sea ice is reacting,” said researcher Sharon Stammerjohn about the intensification and expansion measures. The new metrics allow you to gauge how the system is responding instead of just monitoring the status of the system. “Let’s say your temperature is 99.2 degrees Fahrenheit,” said Stammerjohn. “You have no view of this temperature unless you take it again an hour later and you see that it has changed to 101 degrees. Then you can say, okay, my system is responding to something. “
The fields above show seasonal fluctuations in the amount of sea ice for each region and the entire Southern Ocean. The mean monthly total ice extent (b) peaks in autumn and the mean monthly total ice area (a) peaks in winter. Inter-annual trends in total monthly ice area (c) show that the Antarctic sea ice tended to increase in autumn over the past thirty years. Inter-annual trends in monthly total ice extent (d) show that changes in ice growth in spring led to changes in ice in the following summer and autumn. (Courtesy PR Holland)
Partial declarations
Holland continues to study the Antarctic spring to better understand why the Antarctic sea ice is changing. While Holland’s work helps researchers pinpoint the problem more precisely, scientists continue to develop ideas about why the ice is expanding.
Paradoxically, one study suggests that ocean warming and increased melting of the Antarctic ice sheet are causing the small but statistically significant expansion of sea ice in the region. Another study suggests that rain caused by a warmer climate caused an influx of freshwater into the Southern Ocean, making it less dense and preventing oceanic heat from reaching the sea ice in Antarctica. So far there is no consensus on the reason for the enlargement.
“Some explanations have been offered, but we don’t have the full picture,” said Ted Scambos, a scientist at NSIDC DAAC. “This can only be a ‘we don’t know yet’ case.”
Emperor penguins rest near the coast in Antarctica and hunt for food in the nearby sea ice. (Courtesy K. Watson)
References
Bintanja, R., GJ Van Oldenborgh, SS Drijfhout, B. Wouters, and CA Katsman. 2013. Important role for the warming of the ocean and the increased melt of the ice shelf in the expansion of the Antarctic sea ice. Nature Geoscience 6: 376-379, doi: 10.1038 / ngeo1767.
Cavalieri, DJ, CL Parkinson, P. Gloersen and H. Zwally. 1996, updated annually. Sea ice concentrations from passive Nimbus-7 SMMR and DMSP SSM / I-SSMIS microwave data. Southern Hemisphere. Boulder, Colorado USA: NASA’s National Snow and Ice Data Center (NSIDC) DAAC.
Holland, PR 2014. The seasonality of the Antarctic sea ice trends. Geophysical Research Letters 41, doi: 10.1002 / 2014GL060172.
Holland, PR and Kwok, R. 2012. Wind-Driven Trends in Antarctic Sea Ice Drift. Nature Geoscience 5: 872-875, doi: 10.1038 / ngeo1627.
Holland, PR, N. Bruneau, C. Enright, M. Losch, NT Kurtz, R. Kwok. 2014. Modeled trends in the thickness of the Antarctic sea ice. Journal of Climate 27: 3.784-3.801, doi: 10.1175 / JCLI-D-13-00301.1.
Kirkman, CH, CM Bitz. 2011. The effect of sea ice freshwater flow on Southern Ocean temperatures in CCSM3: Deep Sea Warming and Delayed Surface Warming. Journal of Climate 24: 2,224-2,237, doi: 10.1175 / 2010JCLI3625.1.
Scambos, TA, R. Ross, T. Haran, R. Bauer, and DG Ainley. 2013. An automated station design for cameras and multi-sensors for monitoring polar physical and biological systems: AMIGOS. Journal of Glaciology 59 (214): 303-314, doi: 10.3189 / 2013JoG12J170.
Stammerjohn, S., R. Massom, D. Rind, and D. Martinson. 2012. Regions with Rapid Sea Ice Change: An Interhemispheric Seasonal Comparison. Geophysical Research Letters 39, L06501, doi: 10.1029 / 2012GL050874.
For more informations
NASA National Snow and Ice Data Center (NSIDC DAAC) distributed active archive center
| About the remote sensing data | |
| Satellites | Nimbus 7 and Defense Meteorological Satellite Program (DMSP) F8, F11, F13, F17 |
| Sensors | Scan multichannel microwave radiometer (SMMR), special sensor microwave / imager (SSM / I), special sensor microwave imager / sounder (SSMIS) |
| record | Sea ice concentrations from passive Nimbus-7 SMMR and DMSP SSM / I-SSMIS microwave data |
| resolution | 25 kilometers |
| parameter | Sea ice concentration |
| DAAC | NASA National Snow and Ice Data Center (NSIDC DAAC) distributed active archive center |
The photo in the title graphic shows sea ice in the Bellingshausen Sea off the coast of Antarctica, seen from a NASA Operation IceBridge flight on October 13, 2012. (Courtesy of M. Studinger / NASA)
Like this:
Loading…
Comments are closed.